How do I calculate OTIF [delivery reliability]
It seems easy to calculate the OTIF. However, due to the nature of processes, the most standard calculation may be insufficient. In this article different variants and their calculation method.
Components
OTIF or delivery reliability. It is always made up of Deliver on time and Complete delivery. Nowadays additional standards are added. No Error and No Complaints. The four components then represent an optimal, error-free delivery to the customer within the ratio.
On time:
at agreed delivery time
In full:
Numbers delivered according to order
No error:
Errors and damage when collecting and delivering order
Returns of products and leniency with credit notes
Failure to calculate the correct price
Failure to invoice orders.
No complaints:
Unnecessary contact with the customer about the order
Running away from dissatisfied customers
Complaints from customers
Measuring points.
When measuring the delivery performance, it is important to also take a close look at the entire process and to take measurements at the right points. This way you can determine if the desired OTIF is not achieved, where improvements can be made in the process. Then questions arise such as;
Requested date by customer versus promised date versus delivery times
When does the counter start to count? 1st statement or after authorization?
Where does the counter stop?
Effect of partial deliveries, whether or not agreed.
Revised [approved] delivery dates. Which one counts? Original or revised
Viewpoints OTIF.
When measuring the OTIF, there are basically three options: at order level, at line level or at item level. The choice between these depends on the diversity of delivery and the settlement of the order flow. The goal is to distinguish at the right level and to achieve a realistic OTIF. If you are dealing with many partial deliveries that are placed under 1 order, then measuring at order level is not representative. Then you will want to measure at item or line level. Below are several examples with calculation methods.
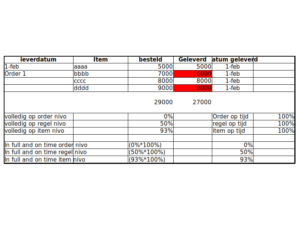
Single order not complete, but on time.
At order level, the order is completely too late. Regardless of the reason, once an item is not delivered complete it is 100% incorrect. On line level there are 2 right and 2 wrong. At Item level the performance is: 27000/29000 and that gives a performance of 93%.
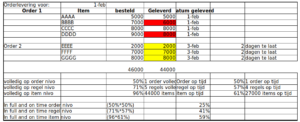
Single order complete, not on time.
Here one gets a completely different effect. Delivery late despite completeness in all cases yields 0% score. If there are partial deliveries, some of which are on time, the score will improve.
Both orders. combined result.
If we take the 1st and 2nd order delivery from the previous examples, it becomes clear how this influences the figures. In particular that the score will yield a more average result. But still at order level, performance is significantly lower than at line or item level.
As mentioned earlier, nowadays the No Error and No complaint are added as a component. This makes the measurement even sharper, but when it comes to achieving the highest degree of customer satisfaction, it is a valid way of measuring.
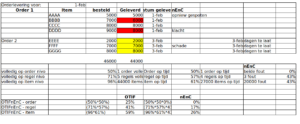
Both orders – OTIFnEnC
Again both orders from the previous examples but now the Error / Complaint performance added. On the bottom calculation lines you can see the effect of this addition on the OTIF performance. Where you still performed reasonably without Error / Complaint, the addition of these two components makes the performance a lot sharper ie lower.
Deliver too early.
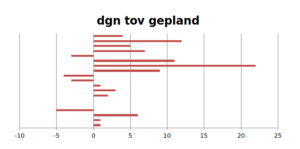
It sounds crazy, but there are many companies that do not deliver on fixed days but have a delivery week to their customer. They do set a planned delivery date, but the organization then has time to deliver within a week.
this will yield the above image. If the limit is 10 days, most orders are on time. In situations like these you can calculate a weighted score.
Implementation
As you can see from the examples, the method of measurement and calculation will lead to significant differences. Keep in mind that the ratios must be recognizable for the organization in order to achieve support. It is often wise to develop your OTIFnEnC over time from a basic ratio to the most competitive ratio that ‘perfectly’ measures your performance to your customer. Below you will find a short step-by-step plan for determining and implementing OTIFnEnC.
- Identification / differentiation of customers.
- do you supply B2C or B2B or combined? which regions or countries do you supply?
- What are requirements / expectations both internally and externally?
- Relevance of measurements, what does it teach us?
- Determine objectives per group
- Partial deliveries required, dynamic delivery times?
- Determining information “hole”
- Plan Development plan to achieve the set measurement goal
- IT Develop IT elements – business intelligence
- Do not exclude temporary manual data reporting
- Inform the organization about purpose, usefulness and necessity.
- Via web, presentations, internal visualisations
- Market / inform customers with objectives and timelines
- Order Web order tracking, directly via sales, publication performance per week / month
- Install follow-up system
- PDCA implementation. Structure of continuous improvement
I wish you the best of luck in improving your customer delivery performance. You can always contact us for further support, advice and implementation.


